Protocell Dynamics with lifesimulatoR
A protocell is a simplified model of a primitive cell-like compartment. In origin-of-life research, protocells are important because compartments can separate an internal chemical system from the external environment. This separation may help maintain local concentrations, protect molecular systems, and allow selection to act on groups of molecules rather than only on individual molecules.
Modern cells use membranes, metabolism, enzymes, genetic information, and highly regulated internal systems. Protocells are much simpler. They may be imagined as primitive compartments that can grow, lose material, and divide.
In lifesimulatoR, protocells are represented using a
simplified educational model. The goal is not to reproduce real
prebiotic chemistry, but to help users explore the basic logic of
compartmentalization, growth, leakage, and division.
Why protocells matter
Before life could evolve into modern cells, early molecular systems likely needed some kind of boundary. Without compartments, useful molecules may diffuse away into the environment. With compartments, molecules can remain close together, interact repeatedly, and potentially be inherited together when the compartment divides.
Protocells are therefore important because they help connect chemistry with biology. They introduce the idea of individuality: a protocell can be treated as a unit that grows, changes, and reproduces.
This gives rise to several important questions:
- Can a protocell grow and divide without modern biological machinery?
- Can useful internal molecules be retained long enough to matter?
- Can daughter protocells inherit useful internal chemistry?
- Can protocells compete for resources?
- How much leakage is too much?
The model in this package does not answer these questions chemically, but it provides a simple simulation framework for discussing them.
The protocell model in lifesimulatoR
The function protocell_simulation() simulates a simple
population of protocells. Each protocell has an internal abundance-like
value. This value can grow, leak away, and trigger division when it
passes a threshold.
The model includes three basic processes:
- Growth: protocells gain internal abundance.
- Leakage: protocells lose some internal abundance over time.
- Division: protocells divide when internal abundance reaches a threshold.
Running a basic protocell simulation
cells <- protocell_simulation(
  n_cells = 20,
  steps = 100,
  growth_rate = 0.2,
  division_threshold = 10,
  leakage_rate = 0.03,
  seed = 123
)

head(cells)
## # A tibble: 6 × 4
## step n_cells mean_abundance max_abundance
## <int> <int> <dbl> <dbl>
## 1 0 20 2.10 2.91
## 2 1 20 2.24 3.14
## 3 2 20 2.39 3.24
## 4 3 20 2.54 3.58
## 5 4 20 2.67 3.78
## 6 5 20 2.80 3.95
tail(cells)## # A tibble: 6 × 4
## step n_cells mean_abundance max_abundance
## <int> <int> <dbl> <dbl>
## 1 95 20 6.84 7.44
## 2 96 20 6.85 7.41
## 3 97 20 6.87 7.43
## 4 98 20 6.89 7.48
## 5 99 20 6.91 7.56
## 6 100 20 6.90 7.49The output is a tibble with one row per time step. It tracks how the protocell population changes through time.
Typical output columns include:
-
step: simulation time step. -
n_cells: number of protocells. -
mean_abundance: average internal abundance across protocells. -
max_abundance: maximum internal abundance in the population.
Understanding the parameters
The function has several important parameters:
-
n_cells: the initial number of protocell-like compartments. -
steps: the number of time steps in the simulation. -
growth_rate: how quickly internal abundance increases. -
division_threshold: the abundance level at which protocells divide. -
leakage_rate: the fraction of abundance lost at each step. -
seed: optional random seed for reproducibility.
These parameters represent simplified biological and chemical ideas.
For example, growth_rate may represent accumulation of
internal molecules, while leakage_rate may represent loss
through an imperfect membrane.
Growth and leakage
The model includes two opposing processes. Growth increases internal abundance, while leakage decreases it.
This captures a simple tension often discussed in protocell models. A protocell needs to retain useful molecules, but early membranes may have been leaky. Some leakage may also be useful if it allows exchange with the environment. A completely sealed protocell may not be able to obtain new material, while a very leaky protocell may not be able to maintain internal chemistry.
Division
When a protocell reaches the division threshold, it splits into daughter protocells. This creates a simple population dynamic. The number of protocells may increase if growth is strong enough relative to leakage.
Division also changes how internal material is distributed. In the toy model, abundance is split between daughter protocells. In real protocell research, this raises questions about inheritance: if useful molecules exist inside a protocell, are they passed on to daughter compartments?
Plotting the result
The package includes plot_simulation() for quick
visualization.
plot_simulation(cells, x = "step", y = "n_cells")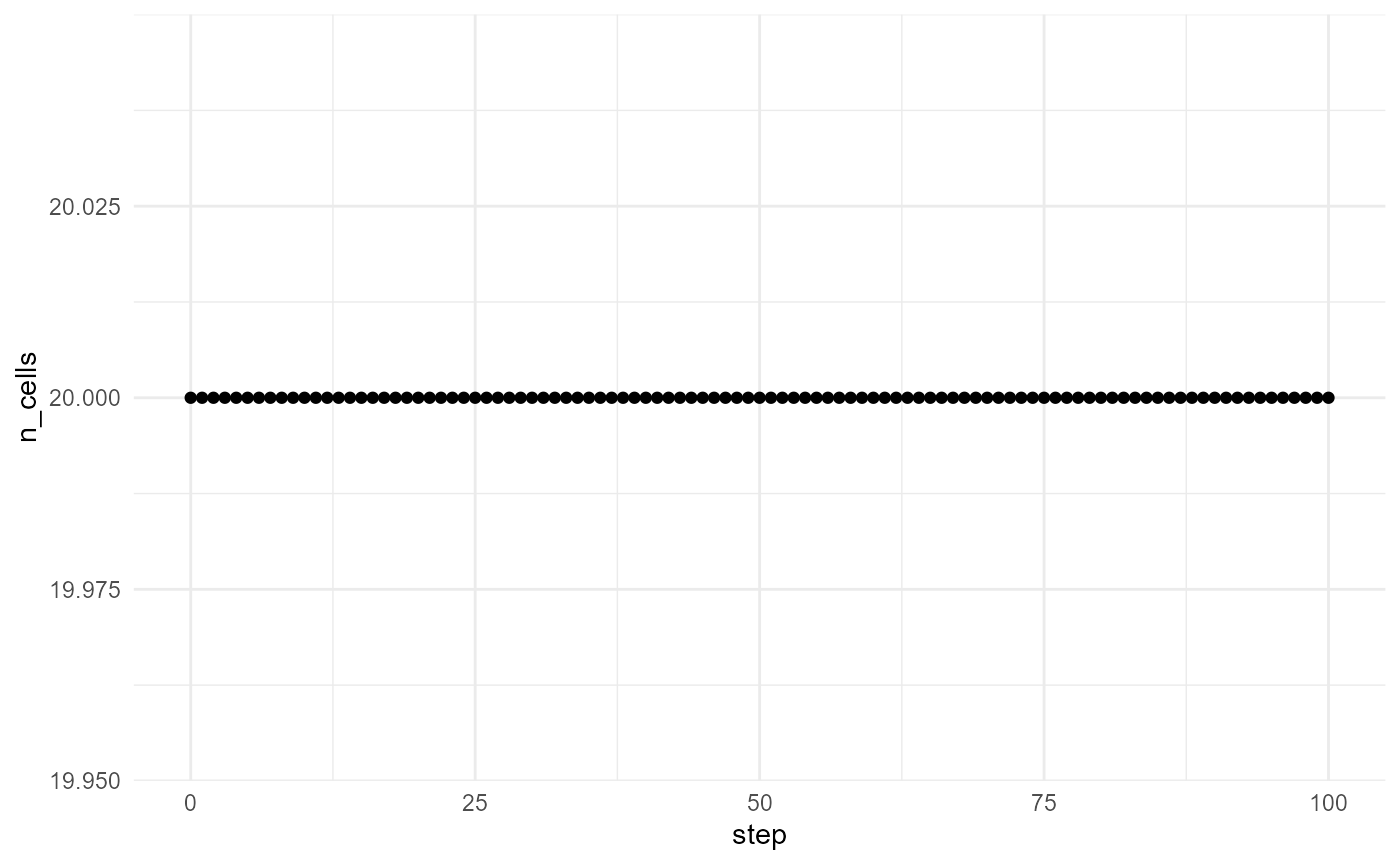
This plot shows how the number of protocells changes through time.
We can also plot mean internal abundance:
plot_simulation(cells, x = "step", y = "mean_abundance")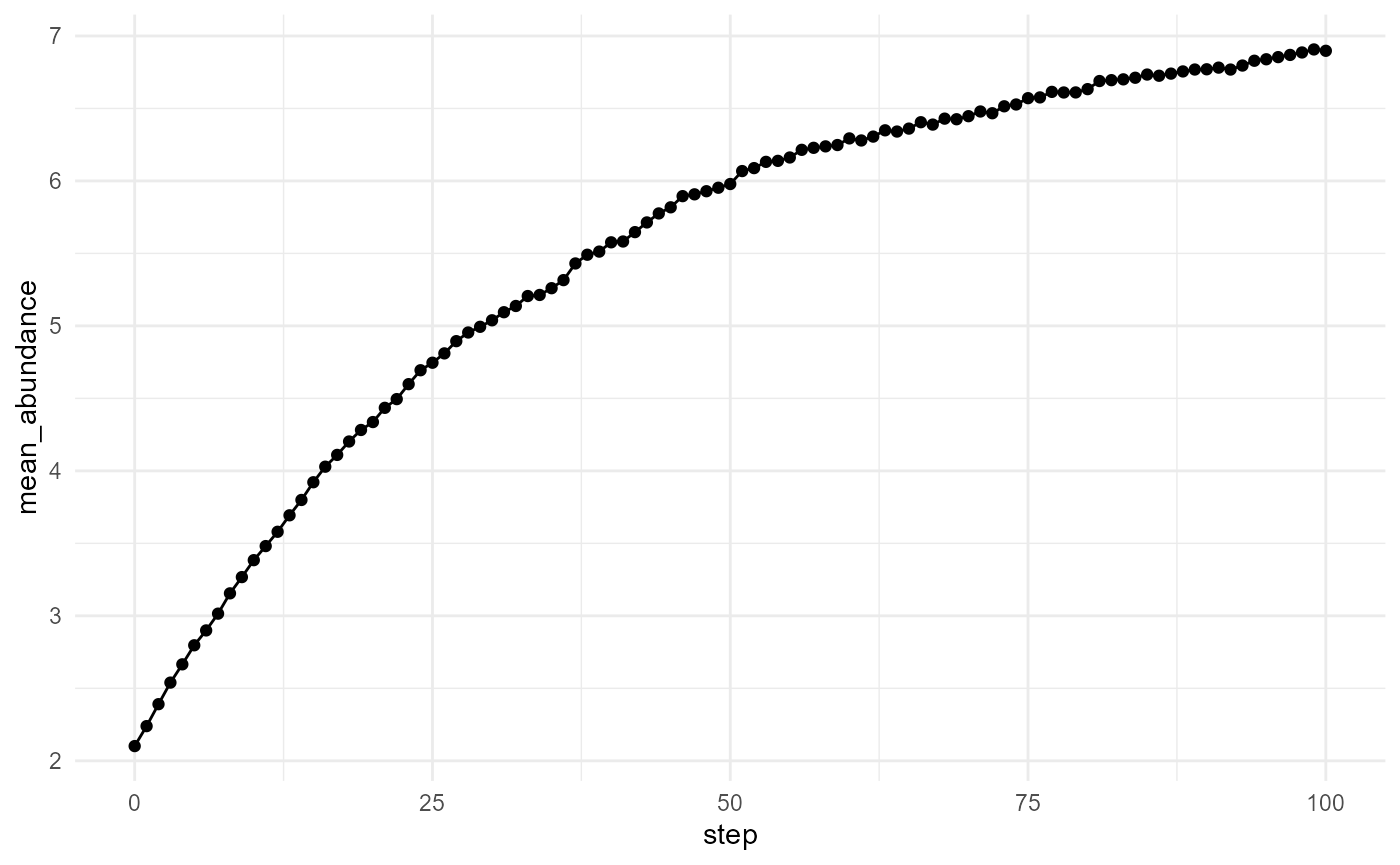
Together, these plots help show whether protocells are growing, dividing, or stabilizing.
Experiment 1: Low leakage versus high leakage
Membrane stability is an important concept in protocell research. A very leaky protocell may not be able to maintain internal chemistry. A perfectly sealed protocell may be too isolated from its environment. A useful protocell likely needs a balance between retention and exchange.
low_leakage <- protocell_simulation(
  n_cells = 20,
  steps = 100,
  growth_rate = 0.2,
  division_threshold = 10,
  leakage_rate = 0.01,
  seed = 123
)

high_leakage <- protocell_simulation(
  n_cells = 20,
  steps = 100,
  growth_rate = 0.2,
  division_threshold = 10,
  leakage_rate = 0.15,
  seed = 123
)

head(low_leakage)
## # A tibble: 6 × 4
## step n_cells mean_abundance max_abundance
## <int> <int> <dbl> <dbl>
## 1 0 20 2.10 2.91
## 2 1 20 2.29 3.21
## 3 2 20 2.49 3.37
## 4 3 20 2.69 3.78
## 5 4 20 2.87 4.06
## 6 5 20 3.05 4.30
head(high_leakage)## # A tibble: 6 × 4
## step n_cells mean_abundance max_abundance
## <int> <int> <dbl> <dbl>
## 1 0 20 2.10 2.91
## 2 1 20 1.96 2.75
## 3 2 20 1.86 2.50
## 4 3 20 1.77 2.52
## 5 4 20 1.68 2.41
## 6 5 20 1.62 2.29This comparison can support a classroom discussion about membrane permeability. In real origin-of-life research, protocell membranes must allow some materials to enter while still retaining useful molecules.
Experiment 2: Changing the division threshold
The division_threshold controls how large or abundant a
protocell must become before dividing. A low threshold may lead to
frequent division. A high threshold may delay division or prevent it
altogether.
low_threshold <- protocell_simulation(
  n_cells = 20,
  steps = 100,
  growth_rate = 0.2,
  division_threshold = 5,
  leakage_rate = 0.03,
  seed = 123
)

high_threshold <- protocell_simulation(
  n_cells = 20,
  steps = 100,
  growth_rate = 0.2,
  division_threshold = 20,
  leakage_rate = 0.03,
  seed = 123
)

head(low_threshold)
## # A tibble: 6 × 4
## step n_cells mean_abundance max_abundance
## <int> <int> <dbl> <dbl>
## 1 0 20 2.10 2.91
## 2 1 20 2.24 3.14
## 3 2 20 2.39 3.24
## 4 3 20 2.54 3.58
## 5 4 20 2.67 3.78
## 6 5 20 2.80 3.95
head(high_threshold)## # A tibble: 6 × 4
## step n_cells mean_abundance max_abundance
## <int> <int> <dbl> <dbl>
## 1 0 20 2.10 2.91
## 2 1 20 2.24 3.14
## 3 2 20 2.39 3.24
## 4 3 20 2.54 3.58
## 5 4 20 2.67 3.78
## 6 5 20 2.80 3.95This simple parameter helps demonstrate that reproduction-like behaviour depends on physical constraints. A system must grow enough to divide, but division also redistributes internal material among daughter protocells.
Experiment 3: Changing the growth rate
The growth_rate parameter controls how quickly
protocells accumulate internal abundance.
slow_growth <- protocell_simulation(
  n_cells = 20,
  steps = 100,
  growth_rate = 0.05,
  division_threshold = 10,
  leakage_rate = 0.03,
  seed = 123
)

fast_growth <- protocell_simulation(
  n_cells = 20,
  steps = 100,
  growth_rate = 0.4,
  division_threshold = 10,
  leakage_rate = 0.03,
  seed = 123
)

head(slow_growth)
## # A tibble: 6 × 4
## step n_cells mean_abundance max_abundance
## <int> <int> <dbl> <dbl>
## 1 0 20 2.10 2.91
## 2 1 20 2.09 2.90
## 3 2 20 2.08 2.86
## 4 3 20 2.07 2.89
## 5 4 20 2.06 2.88
## 6 5 20 2.05 2.86
head(fast_growth)## # A tibble: 6 × 4
## step n_cells mean_abundance max_abundance
## <int> <int> <dbl> <dbl>
## 1 0 20 2.10 2.91
## 2 1 20 2.44 3.46
## 3 2 20 2.80 3.73
## 4 3 20 3.16 4.50
## 5 4 20 3.47 4.98
## 6 5 20 3.79 5.39If growth is too slow, protocells may not reach the division threshold. If growth is strong enough, protocell numbers may increase rapidly.
Conceptual interpretation
This model helps illustrate several key ideas:
- Compartments create individuality.
- Growth can increase the amount of material inside compartments.
- Leakage can reduce internal material.
- Division allows compartment populations to expand.
- Selection could eventually act on protocell-level traits.
In this model, protocell success depends on the balance between growth, leakage, and division. If growth is strong and leakage is modest, protocell numbers may increase. If leakage is too strong or the division threshold is too high, the system may grow slowly or fail to divide.
The important teaching point is that early life-like systems likely required coordination between internal chemistry and physical boundaries. A protocell is not just a bag of molecules; it is a structure that may allow molecular systems to persist, interact, and reproduce as a group.
Educational use
This vignette can be used in class to ask questions such as:
- What happens if leakage is too high?
- What happens if the division threshold is too low?
- How does growth rate affect population size?
- What parameter combinations allow protocells to persist?
- What would need to be added to make the model more chemically realistic?
- How could selection act on protocells rather than only on molecules?
Suggested exercises
- Increase
growth_rateand observe how quickly cells divide. - Increase
leakage_rateand identify when population growth slows down. - Change
division_thresholdand compare early versus delayed division. - Plot
n_cells,mean_abundance, andmax_abundance. - Discuss what real protocells would require that this model does not include.
- Extend the model by adding internal molecular diversity or competition between protocells.