Resource Competition Tutorial
Source:vignettes/resource-competition-tutorial.Rmd
resource-competition-tutorial.RmdPurpose
This tutorial introduces
simulate_resource_competition(). Resource competition is a
core artificial-life idea because agents must interact with an
environment to maintain energy.
In this tutorial, you will run a competition simulation, inspect agent and resource outputs, plot average energy, compare resource regeneration settings, and interpret results carefully.
Basic simulation
competition <- simulate_resource_competition(
  n_agents = 50,
  steps = 50,
  n_resources = 30,
  resource_regen = 0.20,
  seed = 2
)

names(competition)
#> [1] "agents"    "resources" "summary"
Inspect outputs
head(competition$agents)
#>   agent         x           y    energy      speed efficiency
#> 1     1 0.2098611 0.074092349 0.9125861 0.07148919  0.5975891
#> 2     2 0.6856852 0.003262435 1.3371467 0.05521196  0.4830577
#> 3     3 0.5455454 0.717155232 0.9520106 0.04371456  0.5722192
#> 4     4 0.1354033 0.942352902 1.2122130 0.03500740  0.4155581
#> 5     5 0.9259978 0.247930549 0.8222090 0.03275603  0.6277294
#> 6     6 0.8847294 0.780429684 0.7198679 0.09096081  0.3656889
#>   reproduction_threshold age alive step
#> 1               1.529798   1  TRUE    1
#> 2               1.398045   1  TRUE    1
#> 3               1.787090   1  TRUE    1
#> 4               1.521871   1  TRUE    1
#> 5               1.403345   1  TRUE    1
#> 6               1.538384   1  TRUE    1
head(competition$resources)
#>   resource         x          y    amount step
#> 1        1 0.6920055 0.08084101 1.0000000    1
#> 2        2 0.5599569 0.95563857 0.5526803    1
#> 3        3 0.3426912 0.97326925 1.0000000    1
#> 4        4 0.2344975 0.14015762 0.3896781    1
#> 5        5 0.4296028 0.67780596 1.0000000    1
#> 6        6 0.7367007 0.79119735 0.6611856    1
head(competition$summary)
#>   step n_alive mean_energy mean_resource total_resource
#> 1    1      50   0.9920413     0.7355619       22.06686
#> 2    2      50   1.0104519     0.7045157       21.13547
#> 3    3      50   1.0265316     0.6795264       20.38579
#> 4    4      50   1.0365931     0.6723698       20.17109
#> 5    5      50   1.0469975     0.6577956       19.73387
#> 6    6      50   1.0557799     0.6461239       19.38372
The result is a list with:
| Object | Meaning |
|---|---|
agents |
Agent states over time |
resources |
Resource locations and amounts over time |
summary |
Population-level summary by time step |
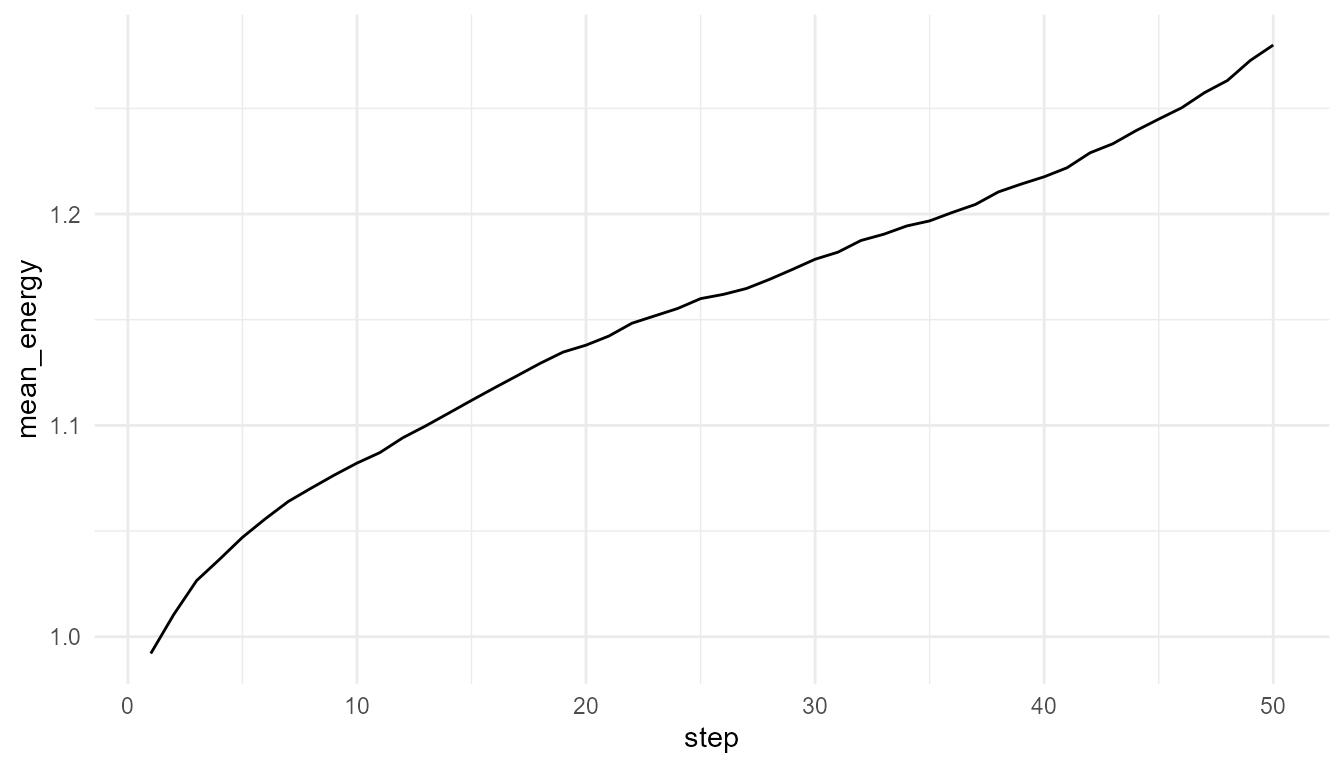
Plot average energy
plot_alife_sim(
  competition$summary,
  x = "step",
  y = "mean_energy",
  type = "line"
)
Compare resource regeneration
low_regen <- simulate_resource_competition(
  n_agents = 50,
  steps = 50,
  resource_regen = 0.05,
  seed = 2
)

high_regen <- simulate_resource_competition(
  n_agents = 50,
  steps = 50,
  resource_regen = 0.40,
  seed = 2
)

rbind(
  low_regen = measure_life_like_complexity(low_regen$agents, trait_col = "energy", time_col = "step"),
  high_regen = measure_life_like_complexity(high_regen$agents, trait_col = "energy", time_col = "step")
)
#>               n unique_values  entropy      mean        sd temporal_variability
#> low_regen  2500          2408 3.135088 0.7603476 0.4187126            0.1812062
#> high_regen 2500          2500 2.881435 1.4541690 0.5888900            0.2640396
#>            mean_abs_change
#> low_regen       0.01159387
#> high_regen      0.01842246
Compare population summaries
data.frame(
  scenario = c("low regeneration", "high regeneration"),
  final_alive = c(tail(low_regen$summary$n_alive, 1), tail(high_regen$summary$n_alive, 1)),
  final_mean_energy = c(tail(low_regen$summary$mean_energy, 1), tail(high_regen$summary$mean_energy, 1)),
  final_total_resource = c(tail(low_regen$summary$total_resource, 1), tail(high_regen$summary$total_resource, 1))
)
#>            scenario final_alive final_mean_energy final_total_resource
#> 1  low regeneration          35         0.4671489              9.00000
#> 2 high regeneration          50         1.8947420             21.34703
Interpretation
Resource regeneration changes environmental constraint. If resources regenerate slowly, agents may lose energy or die. If resources regenerate quickly, more agents may maintain energy.
This illustrates an artificial-life principle:
Agent behavior cannot be understood separately from the environment.