11 Interrupted Time Series Analysis (ITSA): Worked Workflow
This chapter summarizes a practical workflow for implementing ITSA. The goal is to structure applied work so that assumptions are checked, diagnostics are reported, and results are communicated clearly.
Roadmap
We outline a step-by-step process from data preparation to model refinement and reporting. The workflow is compatible with regression-based ITSA and time-series error models.
Learning objectives
- Prepare and structure time-series data for ITSA.
- Use plots to check trends, outliers, and seasonality.
- Specify a segmented regression model and interpret parameters.
- Diagnose autocorrelation and adjust inference.
- Report results with uncertainty and sensitivity checks.
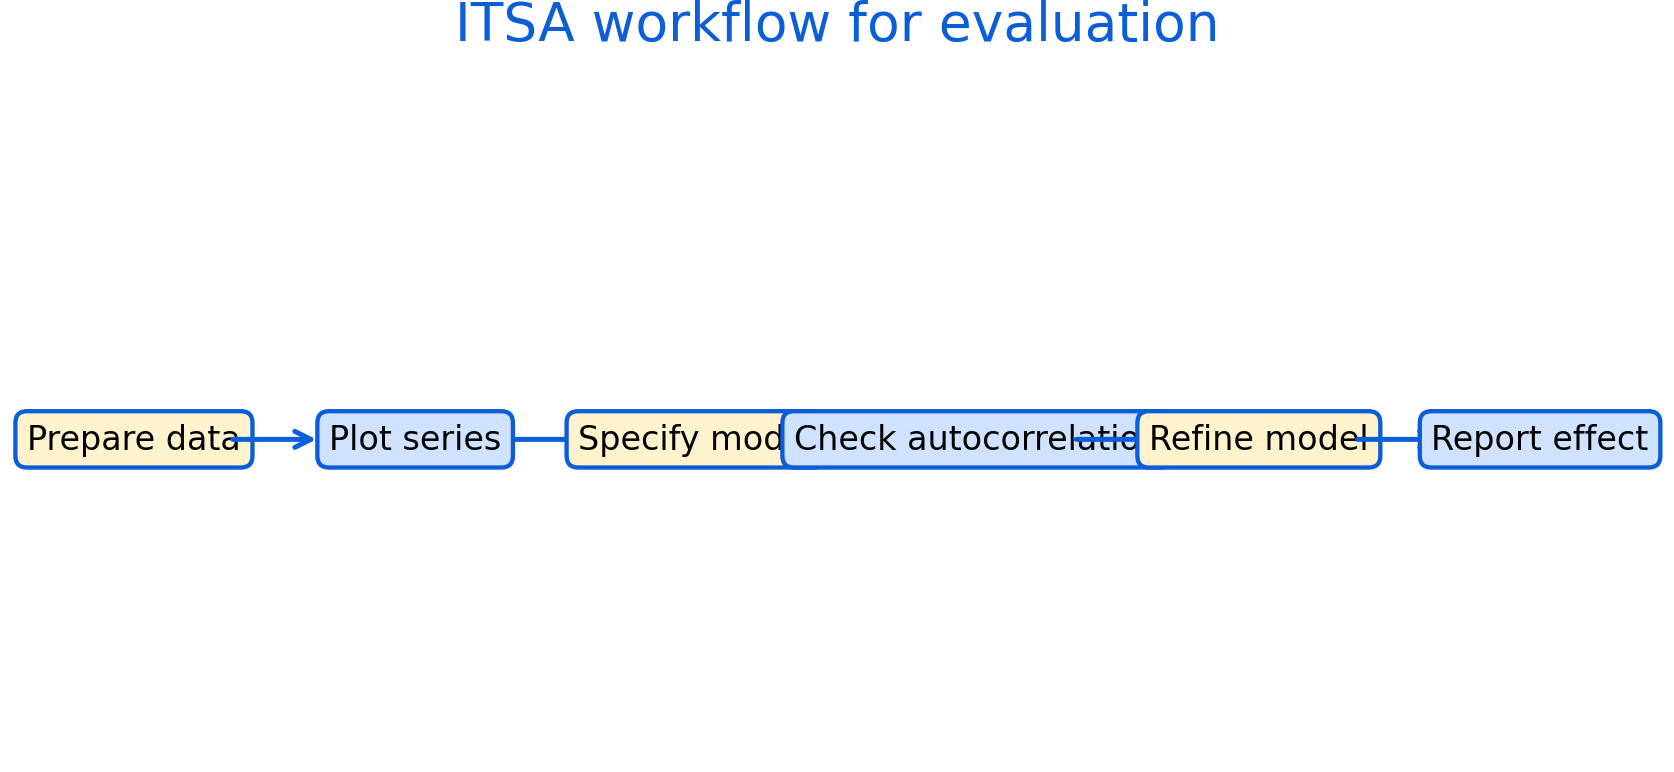
Figure 11.1: Practical ITSA workflow: prepare data, visualize, specify model, check autocorrelation, refine, and report effects with uncertainty and sensitivity checks.
Figure 11.1 is a checklist for applied work. It helps ensure that evaluation is transparent and reproducible.
After fitting a segmented regression, a key check is whether residuals are autocorrelated.
# Template: basic diagnostics after a segmented regression
# install.packages(c("lmtest","sandwich","forecast")) if needed

library(lmtest)
library(forecast)

# model_itsa is the fitted model from the segmented regression
dwtest(model_itsa)                 # Durbin-Watson test for autocorrelation
checkresiduals(model_itsa)         # residual plot + ACF check
11.1 Reporting recommendations
A strong ITSA report includes:
- clear definition of the intervention and timing
- justification for pre and post windows
- plots of the outcome with intervention markers
- model specification with level and slope terms
- autocorrelation diagnostics and corrected inference
- sensitivity analysis (alternative windows, functional forms, seasonality)
Common pitfalls
- Reporting a single model with no sensitivity checks.
- Omitting diagnostic evidence for autocorrelation.
- Over-interpreting short post-intervention windows.
Key takeaways
- A transparent workflow improves credibility.
- Sensitivity checks are part of good evaluation practice.